
This statistical analysis approaches the creative economies from an industry-based perspective along various submarkets.[1] It presents information on the creative enterprises – that is businesses and employees active in the creative industries sector – and their contribution to Swiss economic activity.
Mapping the Creative Industries Zurich Oberland
Our research allows us to analyse the size, importance, trends and regional geography of the creative industries and its 13 submarkets in Switzerland.
Looking at the data, we can explore the number of businesses, employees, full time equivalents, generated gross value added and turnover of the creative industries and its 13 submarkets as well as the development over time and the local importance and specialisation in the municipalites.
Districts: Hinwil, Uster, Pfäffikon
GVA: Estimates based on National Accounts NA, Turnover: Estimates based on national Value Added Tax VAT
Source: FSO, STATENT, NA; STATZH, DISAGG-GVA; FTA, VAT; own calculations by Zurich Centre for Creative Economies (ZCCE) at ZHdK
Overview
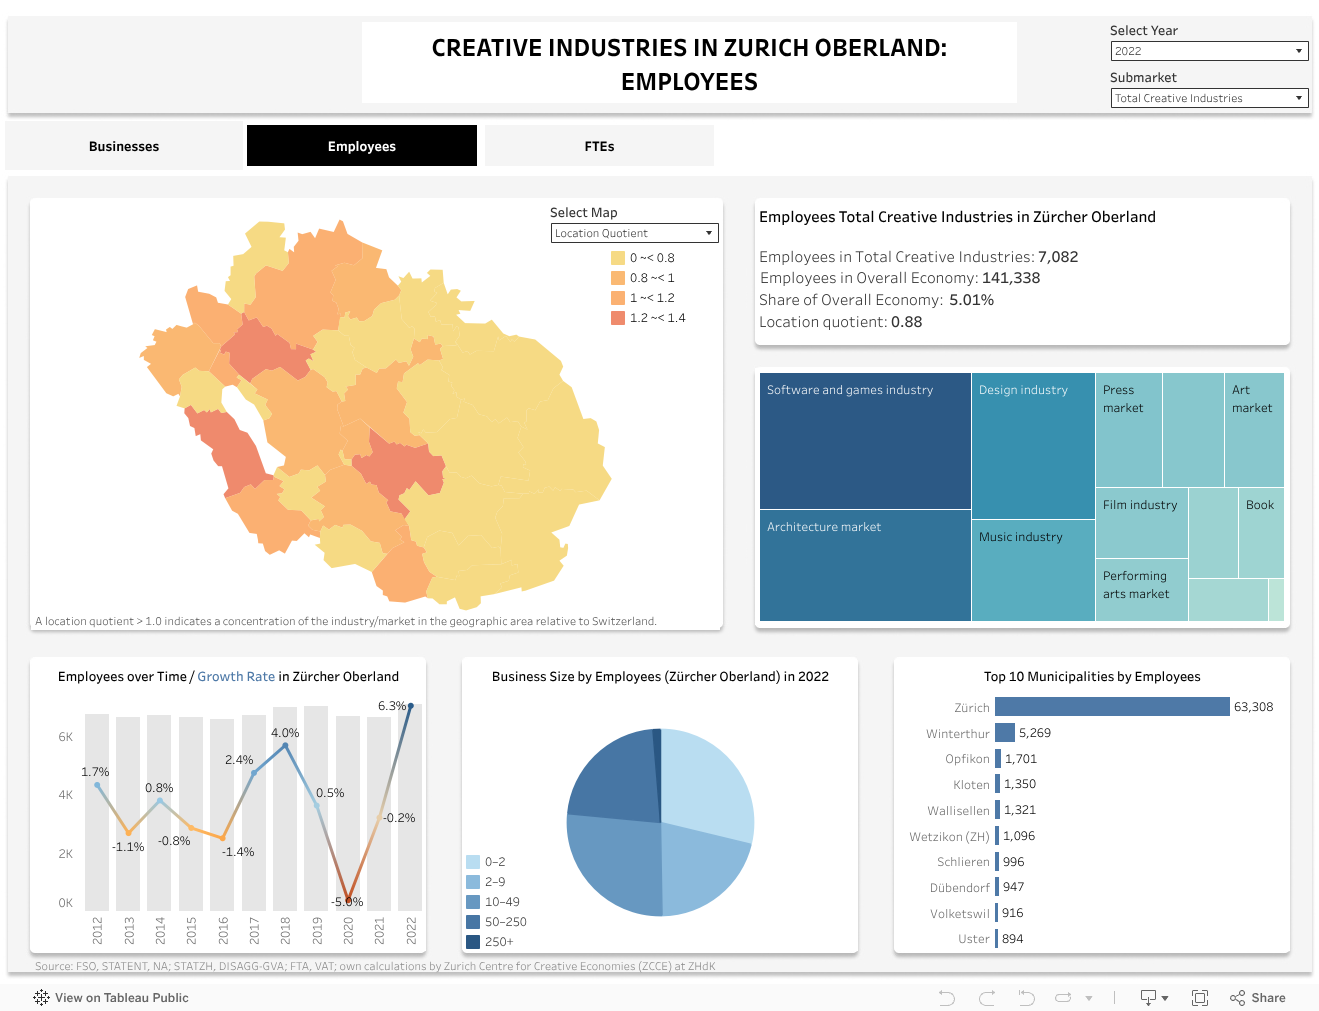
In 2022, around 7,100 persons were employed in Zurich Oberland’s creative industries in 2,200 businesses. This represents 11.0% of Zurich Oberland’s businesses and 5.0% of all employees. The creative industries generated an estimated Gross Value Added (GVA) of CHF 700 million and an estimated turnover of CHF 2.1 billion. This corresponded to almost 3.7% of Zurich Oberland’s GVA and 2.1% of Zurich Oberland’s total turnover.
Employment in Zurich Oberland’s creative industries is highest in the submarkets Software and games industry (22.2%), Architecture market (18.3%), Design industry (13.9%) and Music market (9.7%). These four submarkets account for almsot three thirds of all creative industries jobs.
The figures confirm that the Zurich Oberland’s creative industries are dominated by small businesses. 94.9% are micro-businesses employing up to 10 persons (FTEs). Around four fifth (80.7%) comprise merely one or two persons. Such businesses are known as smallest, i.e., micro-businesses. The pie chart shows that about half (49.8%) of all Zurich Oberland’s creative industries employees work in micro-businesses, i.e., in businesses with less than 10 employees.
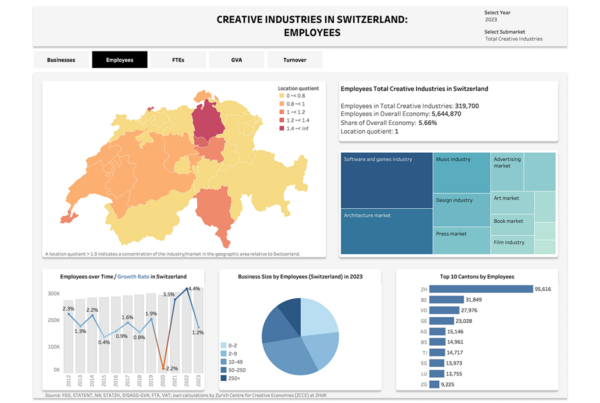
Around one tenth of the Canton Zurich’s creative industries sector is concentrated in the Zurich Oberland region, making a significant contribution to the region’s economy. Following the cities Zurich and Winterthur, Uster, Wetzikon and Dübendorf are among the cantons’ top 10 municipalities for the creative industries.
Developments
In the first year of the pandemic in 2020, the number of businesses in the creative industries Zurich Oberland fell by 1.9% compared to the previous year (compared to -0.5% for the regions’s overall economy), after mostly having increased since 2011.
In 2022, the creative sector recorded 79 more businesses than in 2021, with a total of 2,226 creative businesses. This figure is higher than before the Covid-19 pandemic and represents a new high since 2011. The increase in the creative industries (+3.7%) was therefore higher than in the overall economy (+1.1%). It was most pronounced in Film industry (+14.4%) and Music market (+10.4%), contrary to Broadcasting market (-10.4%).
The number of employees in the creative industries rose by 419 employees (+6.3%) to 7,082 employees, which is also more sharply than in the overall economy (+2.2%). The increase was highest in Film industry (+46.7%), Design industry (+18.6) and Music industry (+9.1%), contrary to Crafts market (-11.6%) and Performing Arts (-10.4%).
The effects of the pandemic are also still visible in the macroeconomic indicators of the creative industries. With the outbreak of Covid-19, the creative sector’s nominal gross value added decreased by 5.1% in 2020 compared to 2019 (overall economy -6.1%).
In 2022, nominal gross value added in the creative industries climbed back at CHF 700 million. At +5.2%, the increase in nominal gross value added in the creative sector between 2021 and 2022 was slightly lower than that in the overall economy (+6.0%).
The strongest increase in nominal gross value added in the creative industries sector in 2022 was in Film industry (+43.4%) and contrary the strongest decrease in Performing art market (-28.9%), where it had recorded the sharpest decline in 2020 (-20.5% resp. -44.8%).[2] That year, many cultural institutions had to close temporarily due to the pandemic.
Methodology
Based on the classification for creative industries and its 13 submarkets according to ZCCE, we calculate the size and the development of the creative industries in Switzerland using the Structural Business Statistics (STATENT), the National Accounts (NA) and the Value Added Tax (VAT).[3]
In Switzerland, the creative industries sector is defined, with reference to the European debate, as those cultural and creative enterprises that are predominantly market oriented and are concerned with the production, distribution and media dissemination of cultural and creative goods and services.
The creative industries Switzerland are subdivided into 13 submarkets.[4] It is here that products and services are created, either for other production and service sectors or directly for the final consumer market. In this sense, the cultural and creative industries are mainly assigned to the private sector of cultural production – thus neither to the public sector (public cultural promotion) nor to the intermediate sector (foundations, associations). However, artists and creative professionals are often active in all three sectors. From their point of view, the three submarkets should be seen as parts of the same system. In addition to its own market structures, the cultural and creative industries also build on the creative potential of the public and non-profit sub-sectors and has an innovative effect on them. Therefore, the cultural and creative industries can only be seen as a holistic system.[5]
Further information in our Creative Economies Reports and in the Research Notes.
Notes
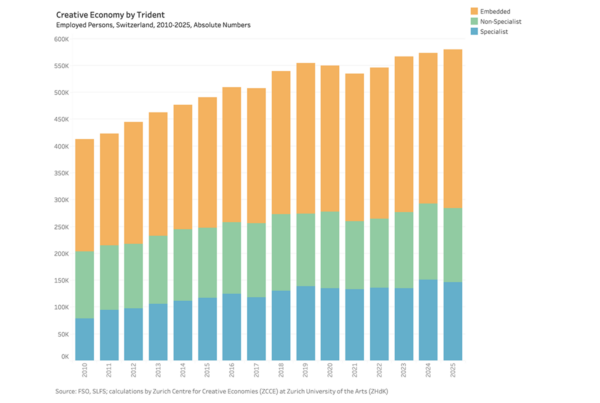
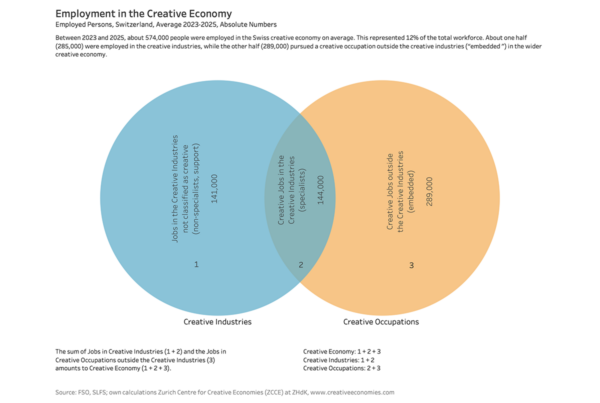
[1] See also our complementary analysis on creative workers, that is the employed persons working in the creative sector as well as persons working in creative occupations outside the creative industries.
[2] The real development of GVA is not (yet) available for methodological reasons. However, the structural business statistics (STATENT) only partially reflects the pandemic’s impact: Thanks to short-time working and loss of earnings allowances, a significant proportion of Old-age and survivor’s insurance (OASI) contributions continued to be paid, even when employees were prohibited from carrying out their work. The data underlying STATENT cannot therefore fully reflect the declines in activity in some sectors. A specific series for the years affected by COVID-19 must therefore be constructed (see FSO, experimental statistics).
[3] See Christoph Weckerle, Simon Grand, Frédéric Martel, Roman Page and Fabienne Schmuki, Entrepreneurial Strategies for a Positive Economy, 3rd Creative Economies Report Switzerland, Zürich 2018.
See Christoph Weckerle, Roman Page, Simon Grand: Von der Kreativwirtschaft zu den Creative Economies. Kreativwirtschaftsbericht Schweiz, Zürich 2016.
[4] See the classification of creative industries according to the approach used by the ZCCE in the annexe.
[5] See Christoph Weckerle, Hubert Theler, Die Bedeutung der Kultur- und Kreativwirtschaft für den Standort Zürich, Dritter Kreativwirtschaftsbericht Zürich, ZHdK 2010.