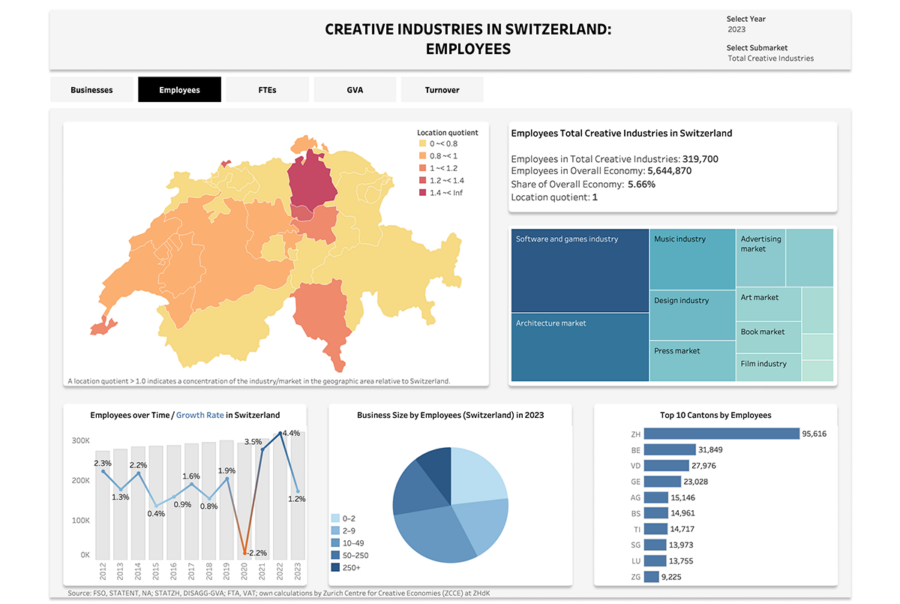
The dashboard presents the Creative Industries Switzerland 2023 by submarket and canton. It contains information on the number of businesses, employees, full time equivalents, generated gross value added and turnover.
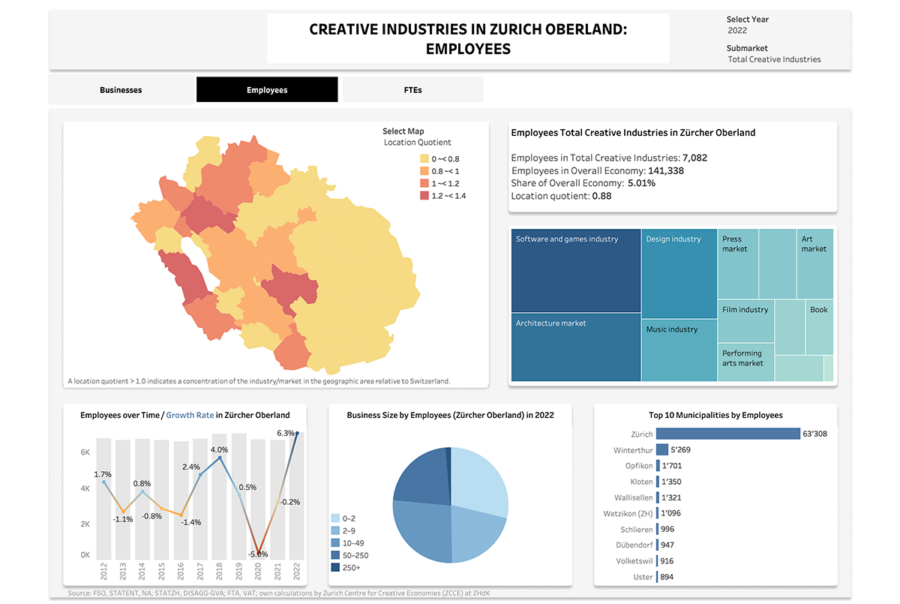
The dashboard presents the Creative Industries region of Zurich Oberland 2022 by submarket and municipality. It contains information on the number of businesses, employees and full time equivalents.
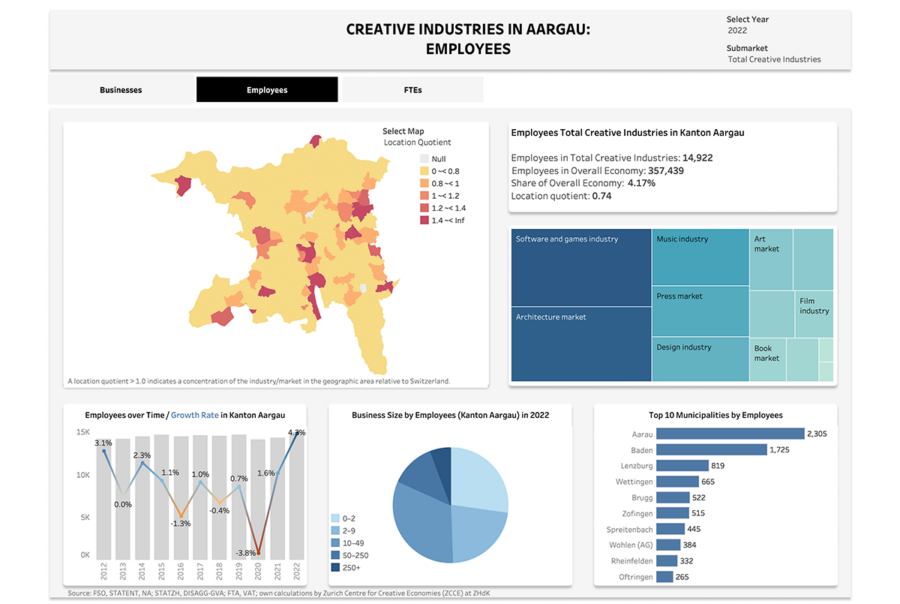
The dashboard presents the Creative Industries Canton of Aargau 2022 by submarket and municipality. It contains information on the number of businesses, employees and full time equivalents.
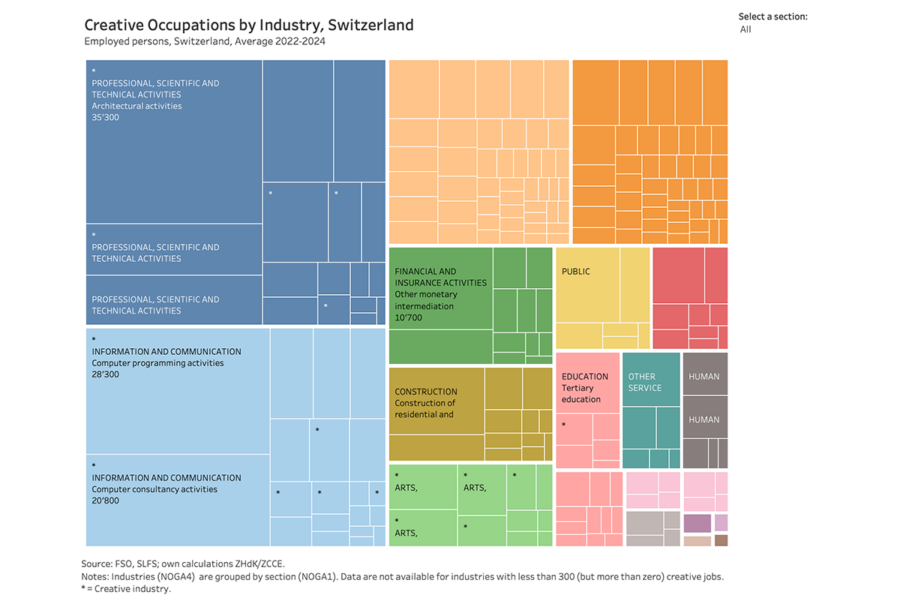
The treemap shows how Switzerland’s 425’000 creative jobs are spread across different industries. The size of each box captures the number of creative occupations within an industry. The colour of each box shows the industry (NOGA1).
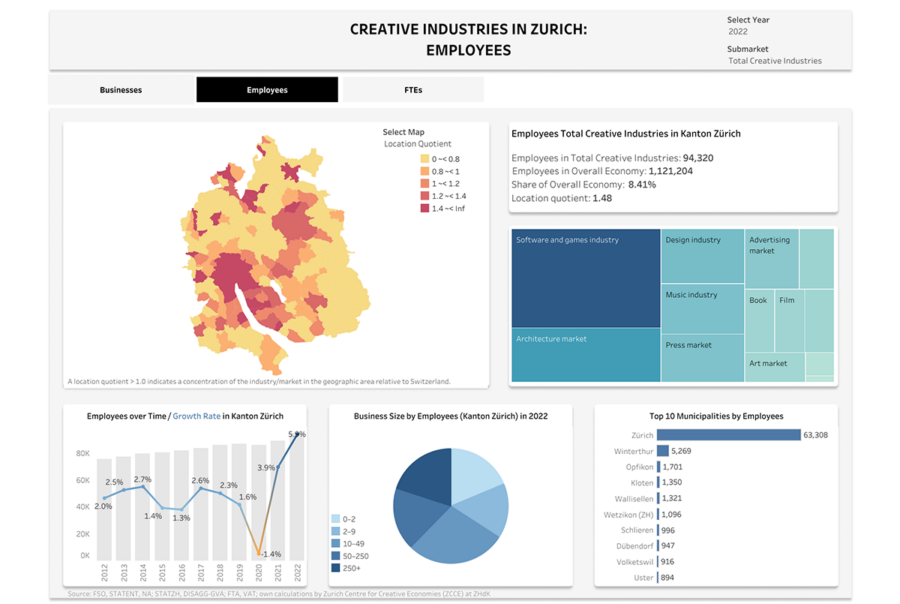
The dashboard presents the Creative Industries Canton of Zurich 2022 by submarket and municipality. It contains information on the number of businesses, employees and full time equivalents.
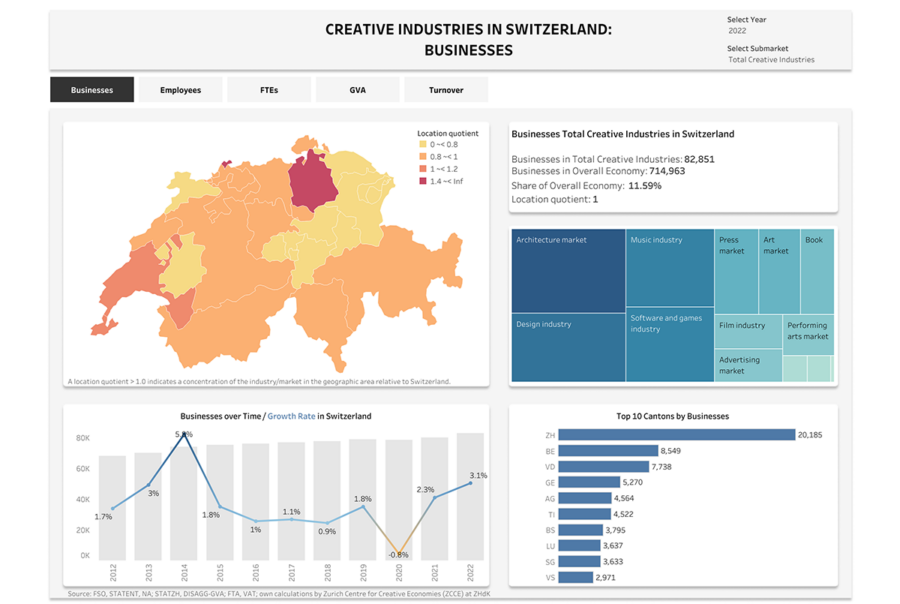
The dashboard presents the Creative Industries Switzerland 2022 by submarket and canton. It contains information on the number of businesses, employees, full time equivalents, generated gross value added and turnover.
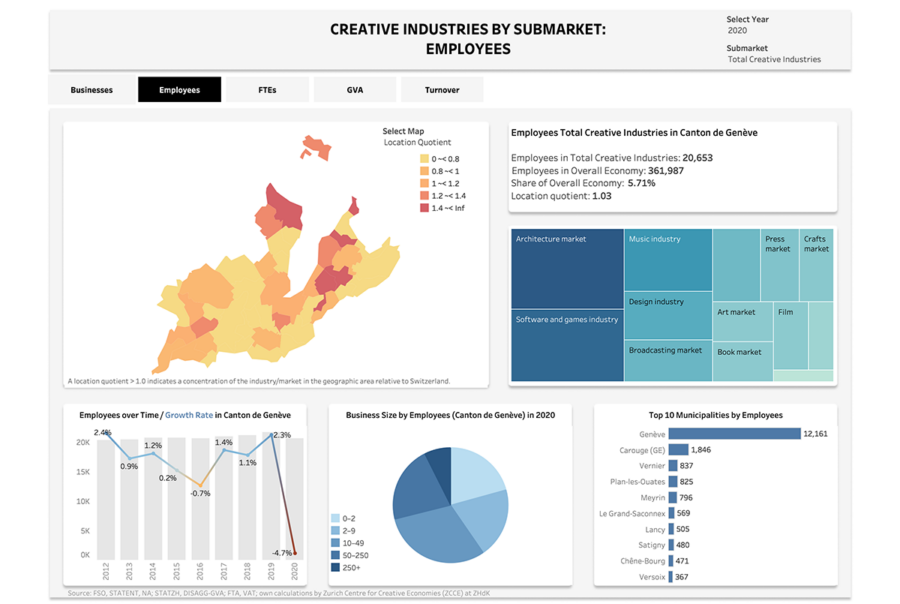
The dashboard presents the Creative Industries Canton of Geneva 2020 by submarket and municipality. It contains information on the number of businesses, employees, full time equivalents, generated gross value added and turnover.
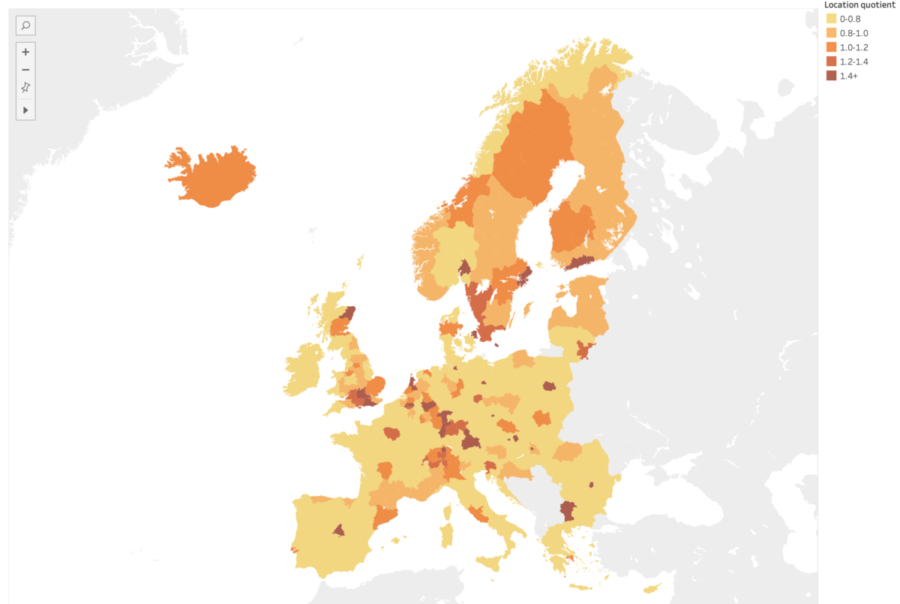
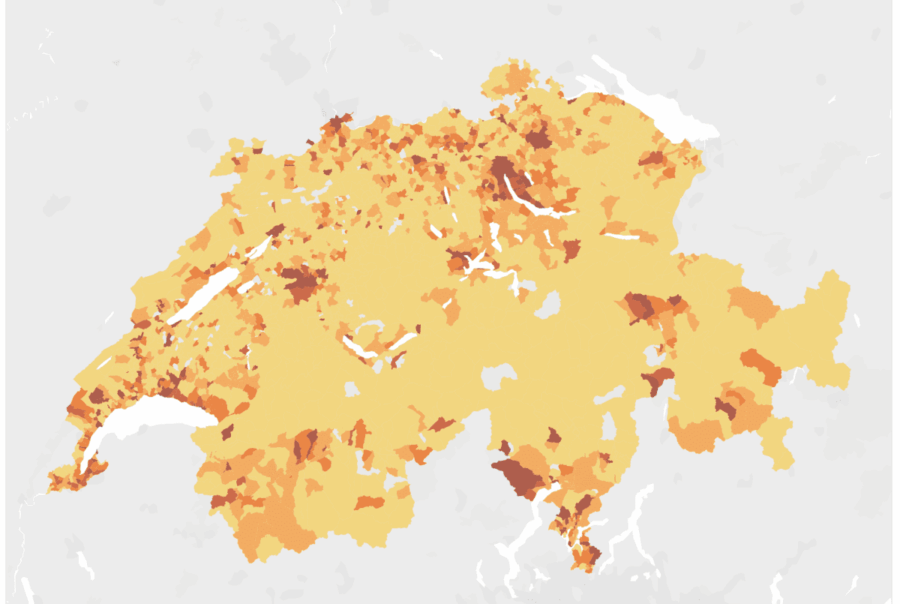
The map shows the number, the regional importance and the concentration of businesses and employees in the creative industries in Switzerland 2018 by municipality.
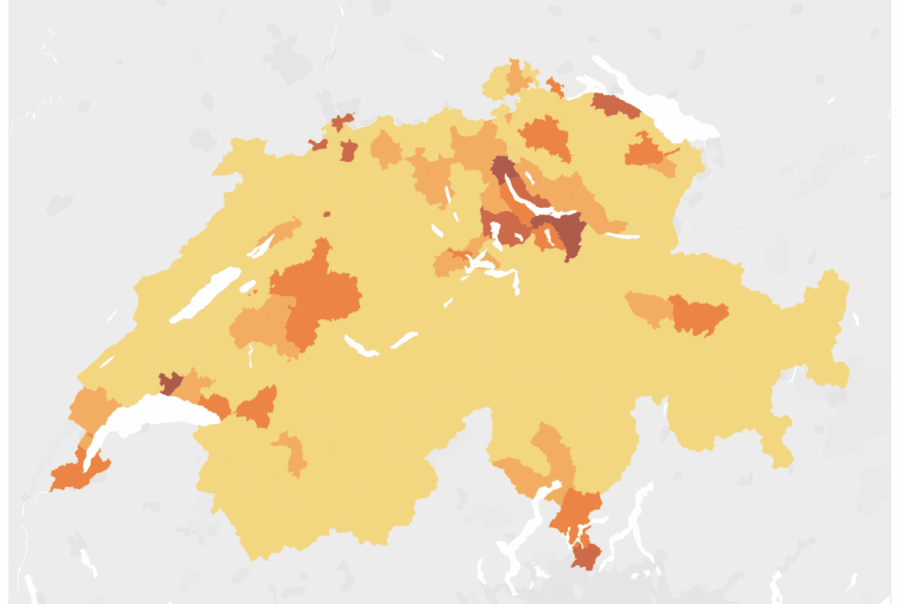
The map shows the number, the regional importance and the concentration of businesses and employees in the creative industries in Switzerland 2018 by district.