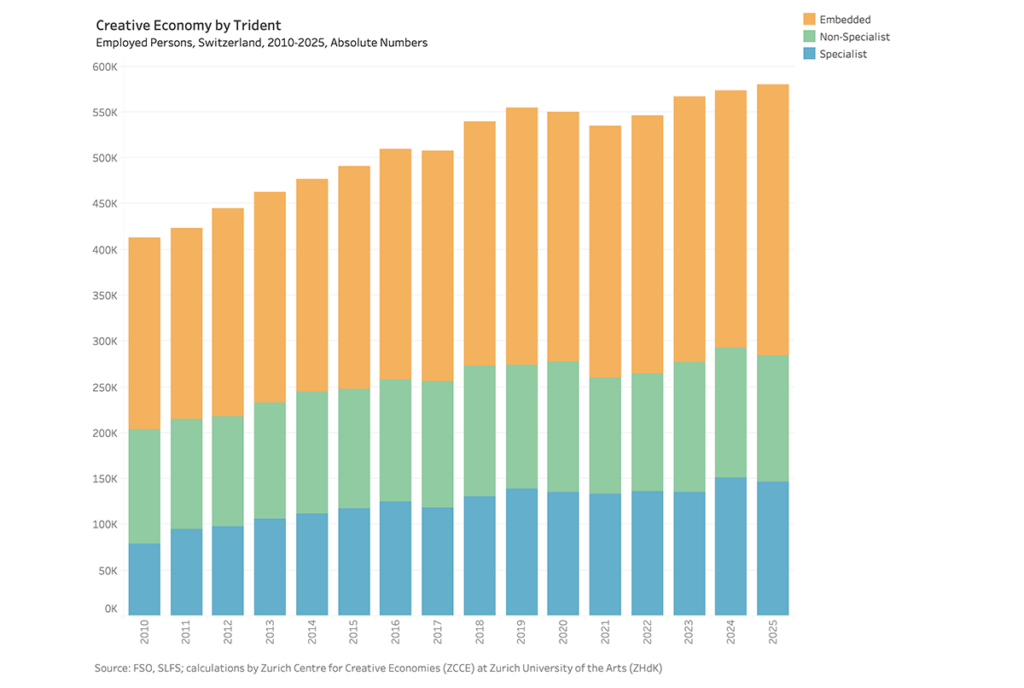
Creative Economies ReportDataSwitzerlandWorkers Creative Economy Employment Switzerland 2010–2025 The figures show the development of the number of employed persons in the Creative Economy Switzerland for the years 2010–2025.Roman PageJune 16, 2026
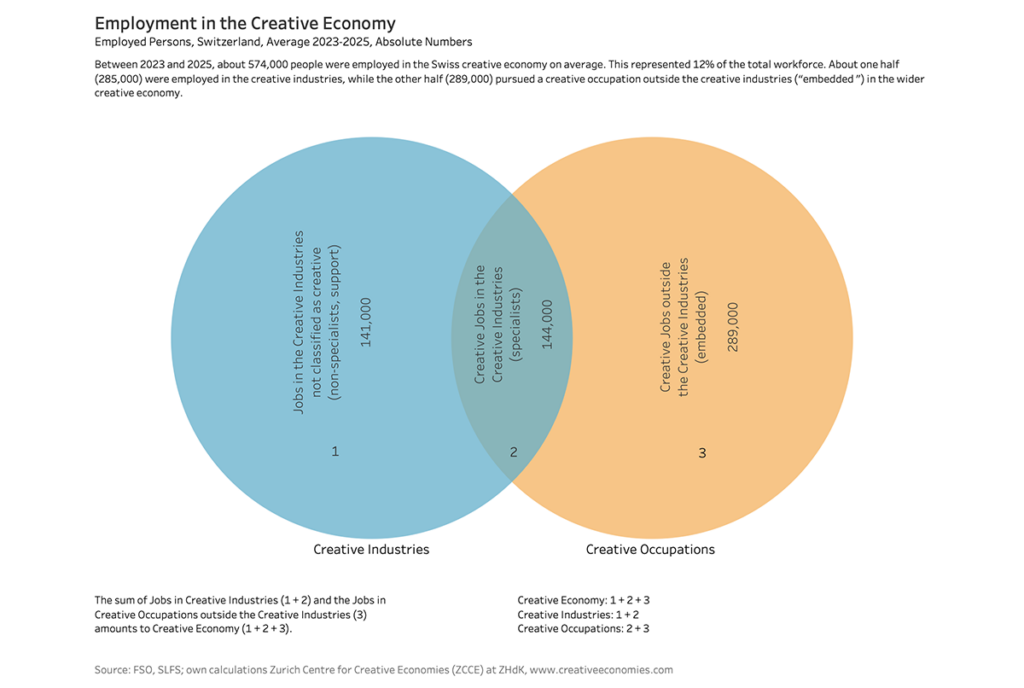
Creative Economies ReportDataFeaturedSwitzerlandWorkers Creative Economy Employment Switzerland 2025 The figures show employment in the Swiss Creative Economy in the period 2023–2025 and the average of these three years.Roman PageJune 9, 2026
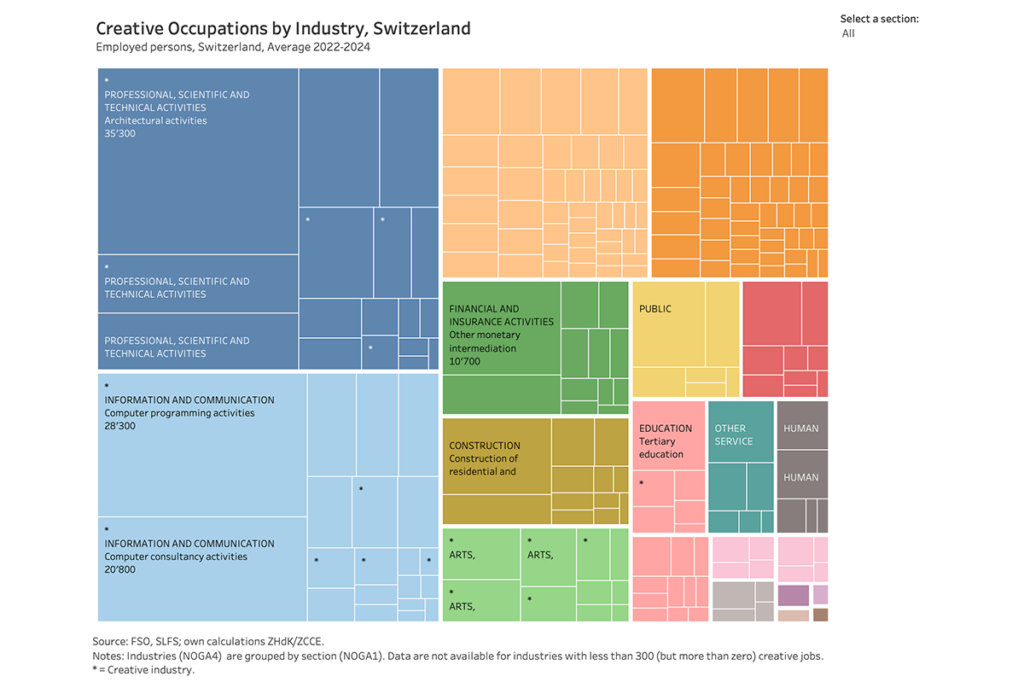
Creative Economies ReportDataSwitzerlandWorkers Who hires creatives in Switzerland 2024? The treemap shows how Switzerland’s 425’000 creative jobs are spread across different industries. The size of each box captures the number of creative occupations within an industry. The colour of each box shows the industry (NOGA1).Roman PageJuly 7, 2025
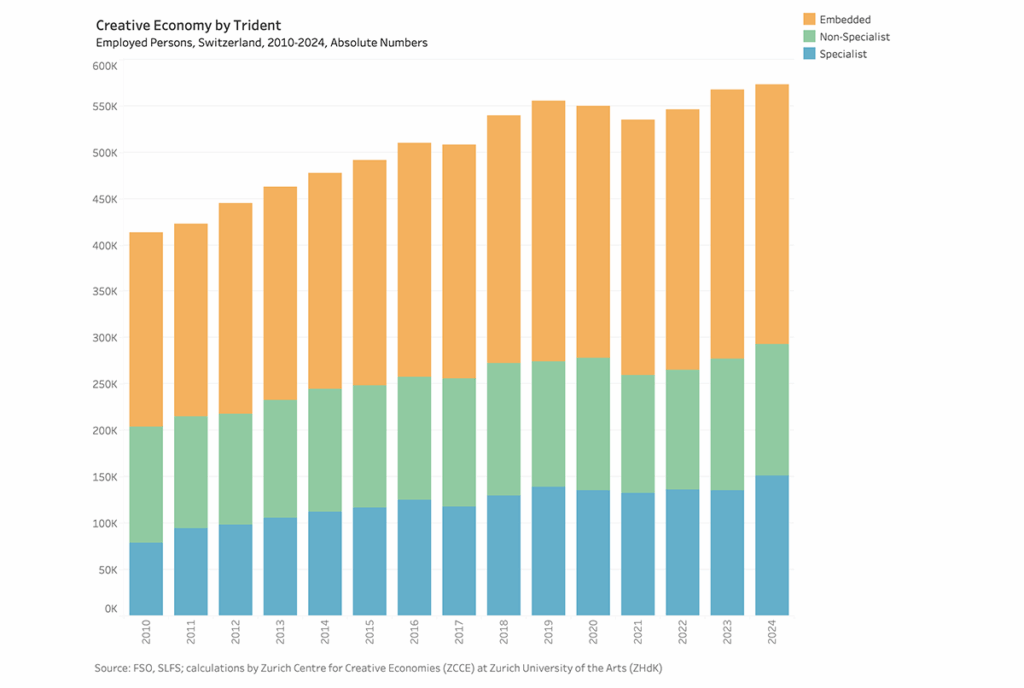
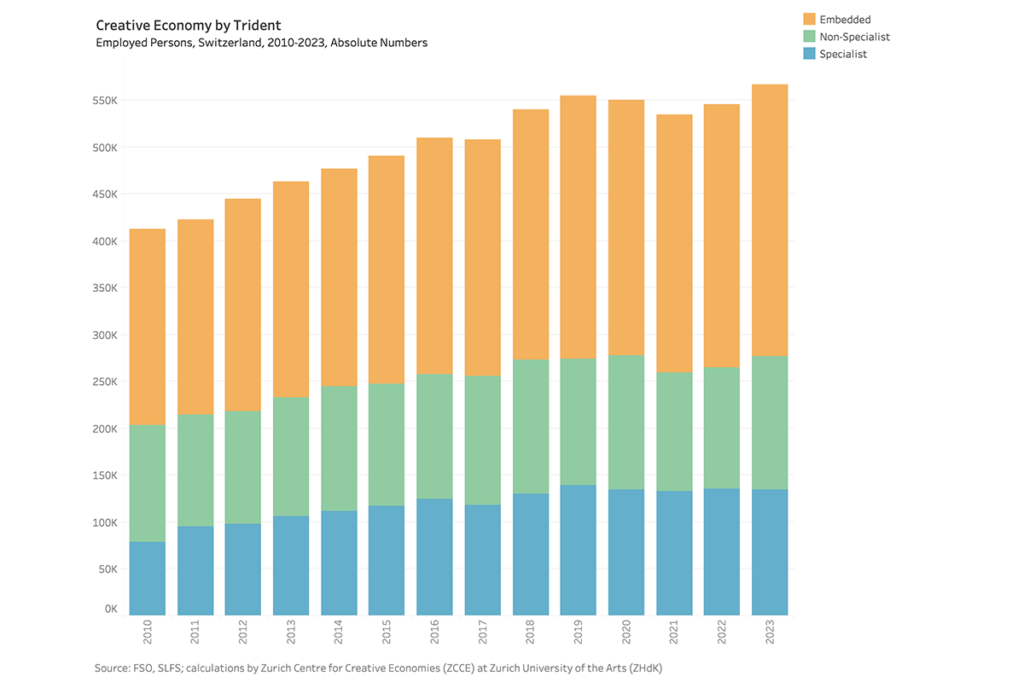
Archive Creative Economy Employment Switzerland 2010–2024 The figures show the development of the number of employed persons in the Creative Economy Switzerland for the years 2010-2024.Roman PageJune 12, 2025
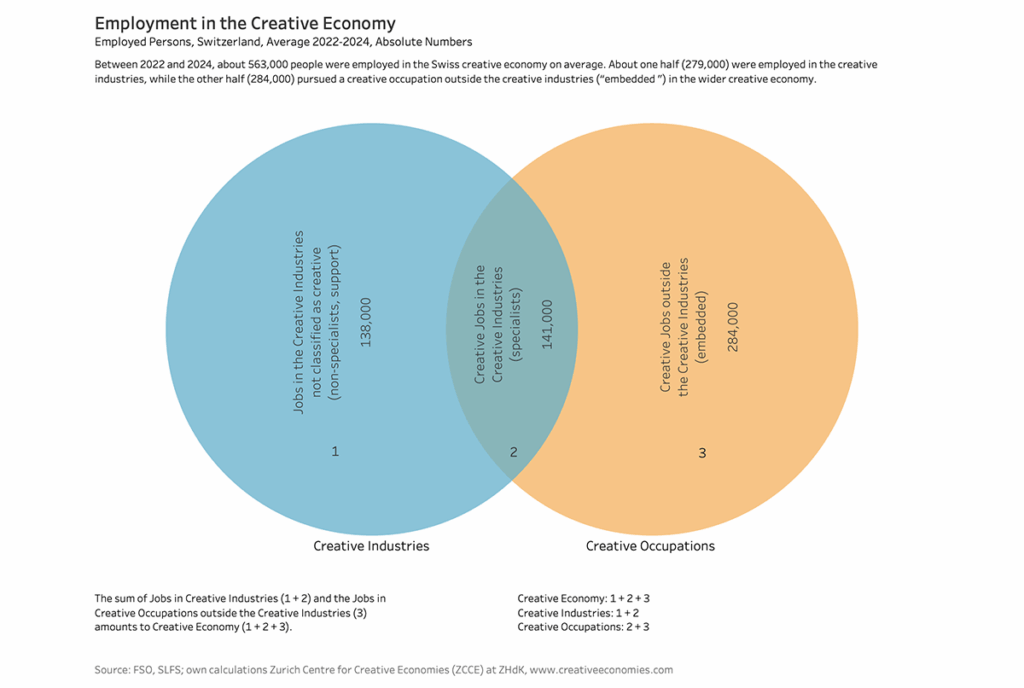
Archive Creative Economy Employment Switzerland 2024 The figures show employment in the Swiss Creative Economy in the period 2022–2024 and the average of these three years.Roman PageJune 12, 2025
Archive Creative Economy Employment Switzerland 2010–2023 The figures show the development of the number of employed persons in the Creative Economy Switzerland for the years 2010-2023.Roman PageSeptember 17, 2024
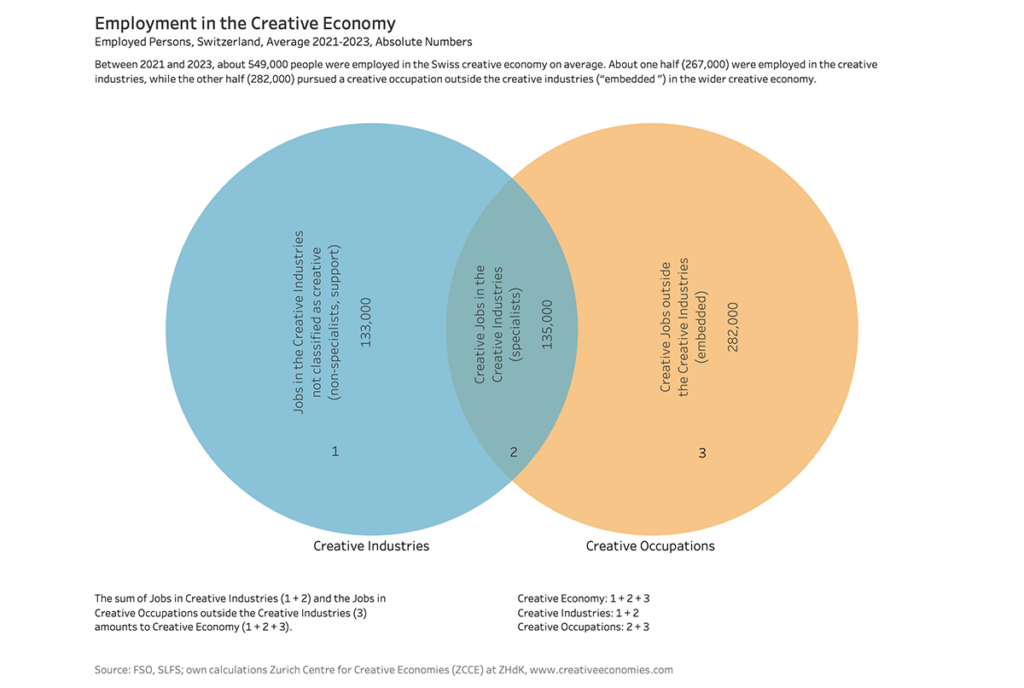
Archive Creative Economy Employment Switzerland 2023 The figures show employment in the Swiss Creative Economy in the period 2021–2023 and the average of these three years.Roman PageSeptember 3, 2024
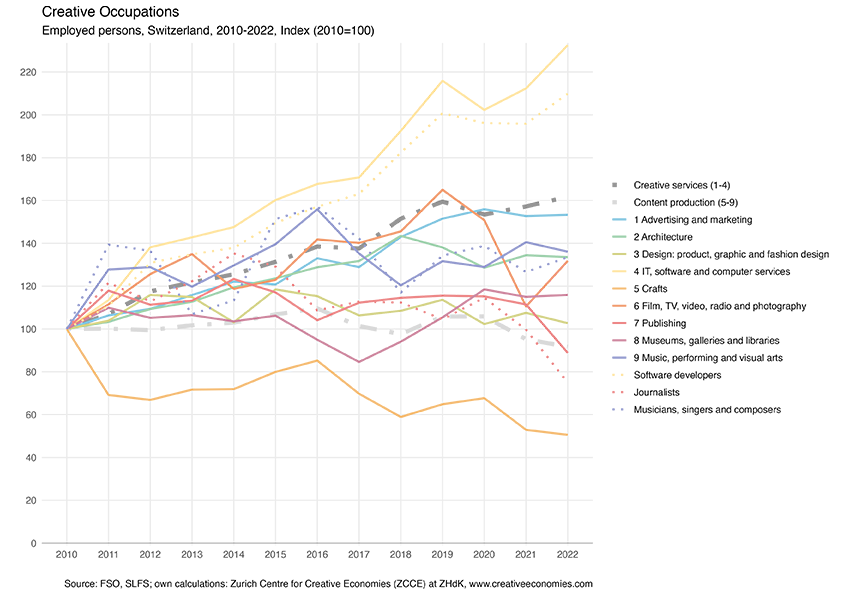
Archive Employment in Creative Occupations Switzerland 2010–2022 The figures show the development of the number of employed persons in Creative Occupations Switzerland for the years 2010-2022.Roman PageDecember 21, 2023
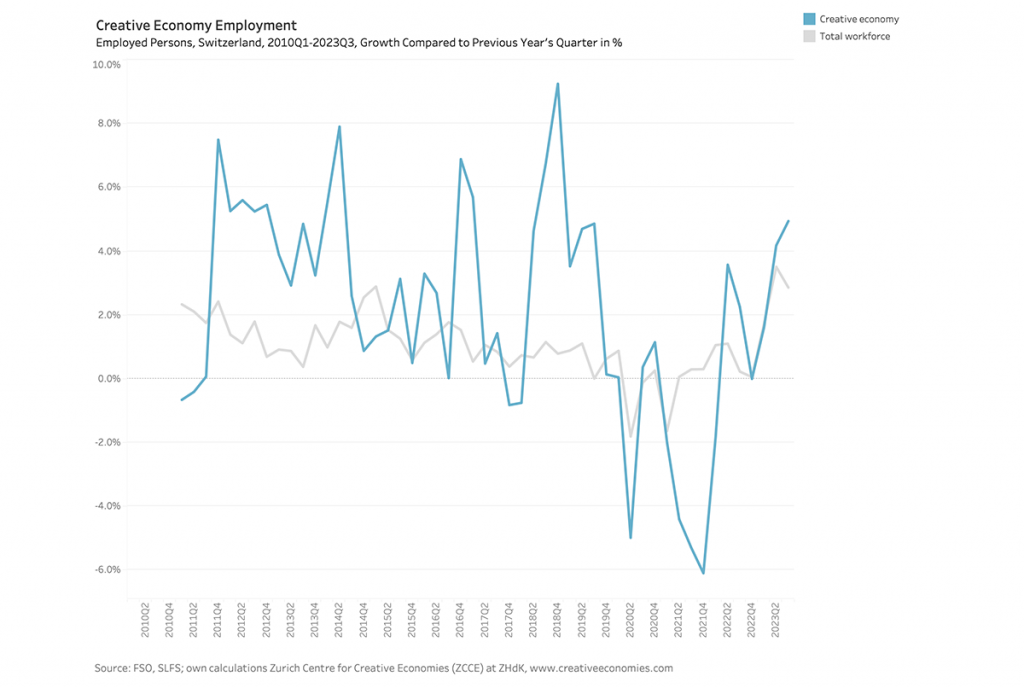
Creative Economies ReportDataSwitzerland Creative Economy Employment Switzerland 2010Q1–2023Q3 The figures show the development of the number of employed persons in the Creative Economy Switzerland for the quarters 2010Q1 to 2023Q3.Roman PageDecember 11, 2023
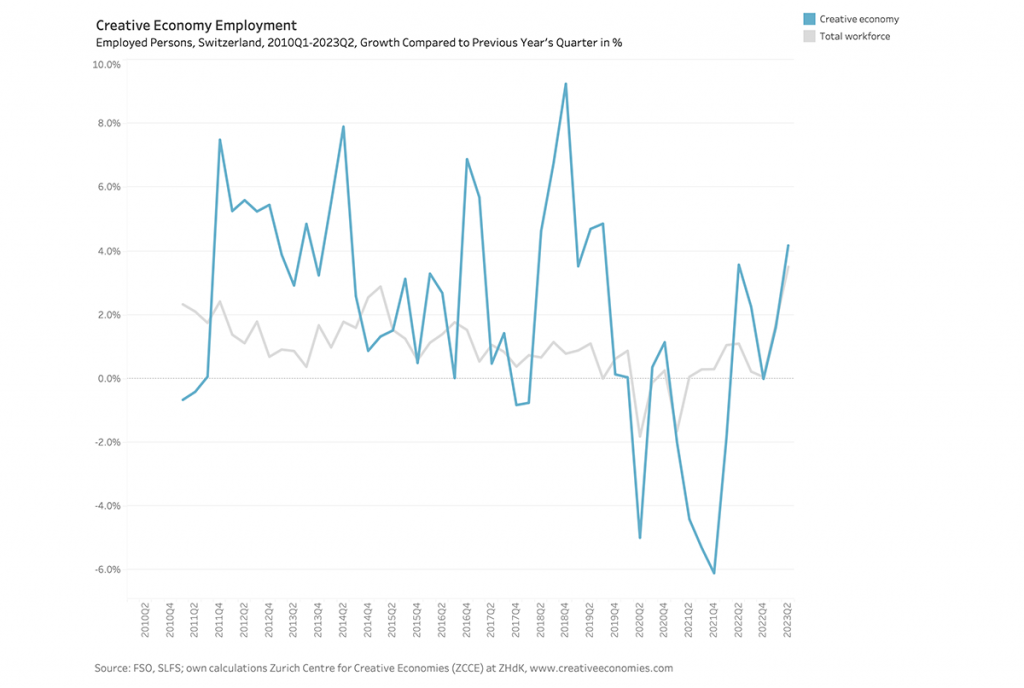
Archive Creative Economy Employment Switzerland 2010Q1–2023Q2 The figures show the development of the number of employed persons in the Creative Economy Switzerland for the quarters 2010Q1 to 2023Q2.Roman PageAugust 30, 2023