The treemap below shows how Switzerland’s 408’000 creative jobs are spread across different industries. The size of each box captures the number of creative occupations within an industry. The colour of each box shows the industry (NOGA1).
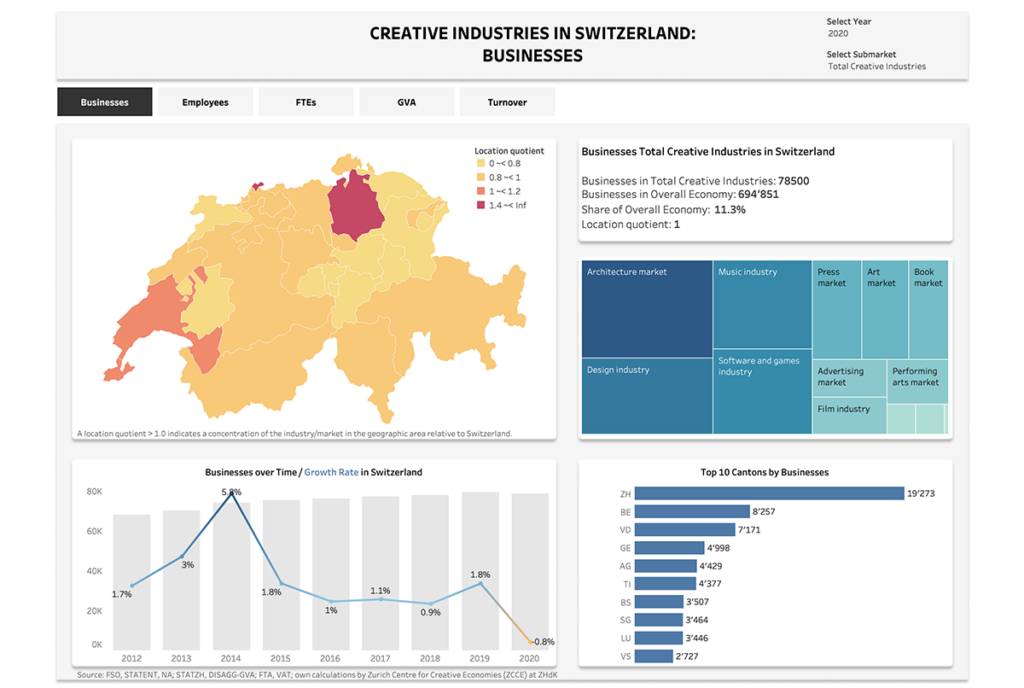
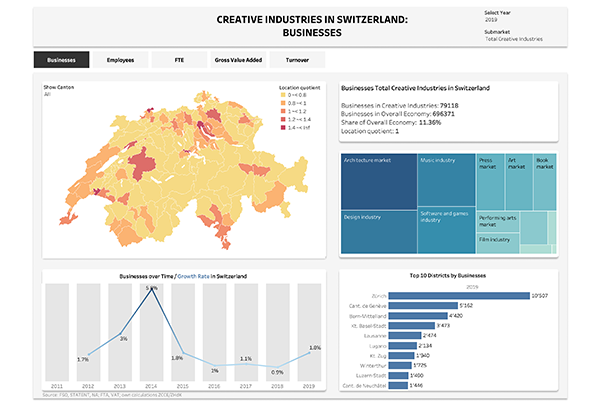
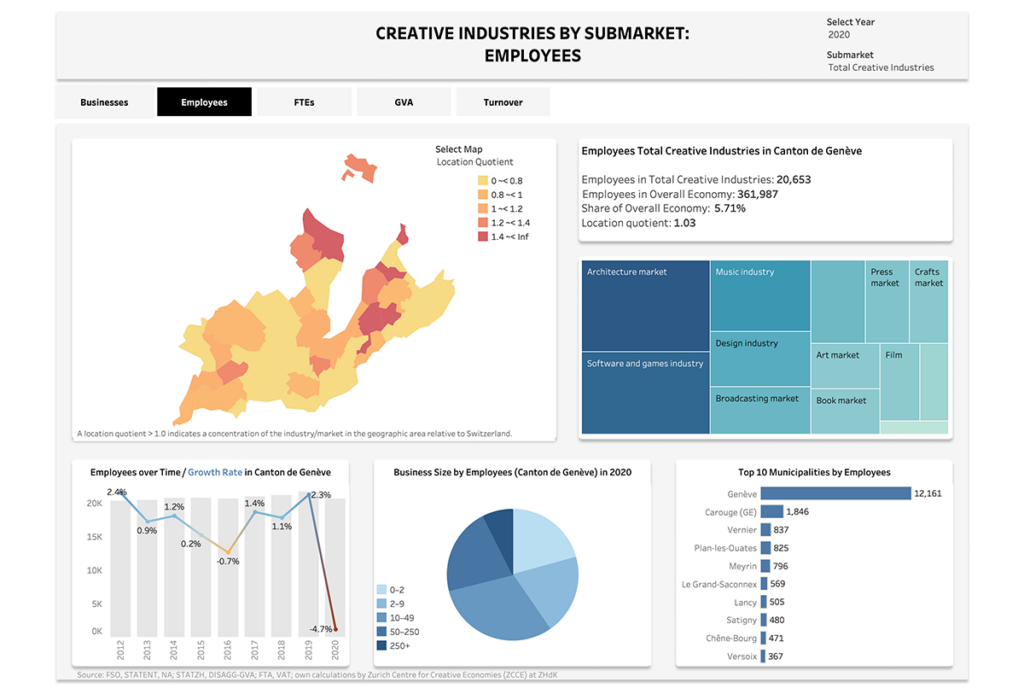
The dashboard presents the Creative Industries Switzerland 2011-2018 by canton. It contains information on the number of businesses, employees, FTEs, GVA and turnover.
The map shows the number, the regional importance and the concentration of businesses and employees in the creative industries in Switzerland 2018 by municipality.
The map shows the number, the regional importance and the concentration of businesses and employees in the creative industries in Switzerland 2018 by district.