Following our Creative Economies Reports, we release here regularly interactive data visualisations that shed light on Switzerland’s Creative Economy.
Who hires creatives in Switzerland
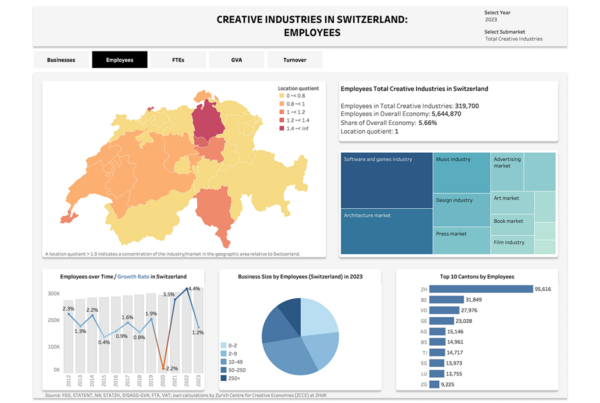
The treemap below shows how Switzerland’s 425’000 creative jobs are spread across different industries. The size of each box captures the number of creative occupations within an industry (NOGA4). The colour of each box shows the industry section (NOGA1).
The Professional, scientific & technical activities sector contains the industry with the largest number of jobs in creative occupations: ‘Architectural activities’. But it is the the Information & communication sector that contains the industry with the highest percentage of jobs in creative occupations (‘creative intensity’): ‘News agency activities’

Methodology
Based on the classification for creative occupations and industries according to UK’s DCMS and Innovation Foundation Nesta,[2] we estimate the size of the Swiss creative economy employment and its three main components (specialist, non-specialist, and embedded employment) using the Swiss Labour Force Survey (SLFS).[3]
This approach rests on the assumption that creative occupations also exist outside the creative industries: «This methodology is based on the theoretical and empirical argument that the creative industries are ‘those industries that specialise in the employment of creative talent for commercial purposes’— that is, have unusually high proportions of their workforce employed in creative occupations (‘creative intensity’).»[4]
Creative economy employment is given by the sum of creative industries employment and all creative jobs in other industries (embedded jobs). The creative economy thus consists of three types of employees:
- Non–specialists (support): employed persons working in a creative industry, but who are not themselves employed in a creative occupation, for instance, a bookkeeper at a publishing company.
- Specialists: persons working in creative occupations in creative industries, for instance, a dancer in an ensemble or a journalist writing for a daily newspaper.
- Embedded: persons working in creative occupations outside the creative industries, for instance, a game designer working in financial services.
Further information in our Creative Economies Reports and in the Research Notes.
Notes
[1] See also our complementary analysis on creative industries enterprises with their businesses and employees.
[2] The Dynamic Mapping methodology, originally applied by Nesta to classify the creative economy, consists of three stages. First, a set of occupations is identified as creative. Second, the workforce intensity of these occupations is calculated for each industry. Third, based on the distribution of creative intensity across industries, a threshold intensity is identified, above which all industries are determined to be creative for measurement purposes, while those below the threshold are not. Finally, creative economy employment is estimated according to the Creative Trident approach.
See the classification of the creative occupations and industries according to UK’s DCMS and Innovation Foundation Nesta in the annexe.
[3] See Frédéric Martel, Christoph Weckerle, Roman Page, Grand Simon: «Sleeping Beauty – four research notes on the effects of the corona crisis». I-IV, ZCCE/ZHdK, 2020.
See Christoph Weckerle, Simon Grand, Frédéric Martel, Roman Page and Fabienne Schmuki, Entrepreneurial Strategies for a Positive Economy, 3rd Creative Economies Report Switzerland, Zürich 2018.
See Christoph Weckerle, Roman Page, Simon Grand: Von der Kreativwirtschaft zu den Creative Economies. Kreativwirtschaftsbericht Schweiz, Zürich 2016.
[4] Bakhshi Hasan, Hargreaves Ian, Mateos-Garcia Juan: A Manifesto for the Creative Economy. Nesta, London 2013.